(+) Day-Trade Strategies

♞ Introduction to Day-Trading Strategies
Day-trading strategies are very popular among Forex traders as they offer the opportunity to generate quick and consistent profits on a daily basis. Day-traders use high capital leverage, which exposes them to elevated levels of market risk. They may trade any pair among the Forex majors (USD, EUR, JPY, CHF, CAD, AUD, NZD), but they tend to prefer three specific pairs—EURUSD, GBPUSD, and USDJPY—due to their tightest spreads in the market.
🛠 Characteristics of a Day-Trading Strategy
The following day-trading strategies are characterized by a high take profit/loss (P/L) ratio. The P/L ratio in day-trading strategies is significantly higher than in scalping strategies and may even exceed 2. In contrast to scalping, these strategies generate a much lower number of trades per day, typically between 3 and 6.
■ Daily Trades: 3 – 6 trades
■ Profit/Loss Ratio: 1.5 – 2.5
■ Leverage: 1:5 – 1:30
■ Spreads: very important (max 2.0-2.5 pips)
■ Slippage: very important
■ Overnight Charges: Day-Traders should not keep open positions overnight, therefore irrelevant
■ Upcoming News: they generally avoid trading 30 minutes before and after important news
As with scalping, day-trading should be limited to low-cost trading opportunities. This means a Forex day-trader typically chooses to trade only the Forex majors. In the case of a metals day-trader, the focus is usually on Gold and Silver.
The trading cost of any day-traded asset can be reduced by joining a trading rebate plan: ► Online Forex Brokers
These are some trading strategies for day-traders.
♔ Day-Trading Strategies
|
TRADING STRATEGIES |
ASSET AND TIMEFRAME |
INDICATORS |
TAKE PROFIT AND STOP-LOSS |
MORE INFO |
|
THE STOCHASTIC DAY-TRADING STRATEGY |
■ M5 time frame ■ EURUSD and GBPUSD ■ 2-4 daily trades |
■ Stochastic Oscillator Settings at 5,3,3 ■ Fibonacci Retracement Standard settings |
■ Take Profit: 40-50 pips ■ Stop-Loss: 15-20 pips
■ Profit/Loss Ratio: 2.5 |
|
|
BOLLINGER-RSI DAY-TRADING STRATEGY |
■ M5 time frame ■ Forex Majors ■ 5-7 daily trades |
■ Bollinger Bands (i) 12 Periods (ii) Deviations 2 (iii) Shift 0
■ RSI The standard settings (14,9) |
■ Take Profit: 50-70 pips ■ Stop-Loss: 20-25 pips
■ Profit/Loss Ratio: 2.5 |
|
|
BREAKOUT STRATEGY |
■ Multiple Timeframes ■ Forex Majors ■ Metals and Energy ■ Stocks and Indices ■ 1-3 daily trades |
■ Support/Resistance ■ Chart Patterns ■ MACD/RSI MACD or RSI charts divergences |
■ Variable Stop-Loss and Take-Profit levels ■ Profit/Loss Ratio: Higher than 3 |
|
|
TRADE THE FALSEBREAK CANDLE |
■ Multiple Timeframes ■ Forex Majors ■ Metals and Energy ■ Stocks and Indices ■ 2-4 daily trades |
■ Closest support and resistance levels ■ A Falsebreak candle. |
■ Take Profit: 200-250 pips
■ Stop-Loss: 80 pips ■ Profit/Loss Ratio: 2.5 |
■ Day-Trading Strategies
ForexExperts.net
🔗 READ MORE
» Introduction to Trading Strategies
♞ DAY-TRADE STRATEGIES
» Falsebreak Candle
» Bollinger-RSI
» Stochastic Day-Trade
» Breakout Strategy
♚ SWING-TRADE STRATEGIES
» Riding the Trend
» Moving Envelopes
» MACD Swing
♜ SCALPING STRATEGIES
» Stochastic Scalper
» Bollinger-RSI Scalping
» Hit-Run Trading
♟ STRATEGIES FOR BEGINNERS
» News-Trading
» Follow-The-Trend
» Support and Resistance
» Fibonacci Retracements
» Stochastics Trading
» Chart Patterns
💱 MARKET CORRELATIONS
» US Yields and USDCHF
» Crude Oil and Forex
» USDJPY and US Stock Indices
» AUD and Gold Price Correlation
FALSEBREAK CANDLE TRADING STRATEGY
Trading strategy using support and resistance levels, with a false break candle as the trigger.
 TRADING STRATEGY
■ Style: Day-Trading Strategy
■ Name: Falsebreak Candle Trading Strategy
FINANCIAL ASSETS
 TIMEFRAME
■ M5 timeframe (5-minutes)
■ 5-7 daily trades
 INDICATORS & SETUP
This simple strategy uses no indicators; instead, it relies on nearby support and resistance levels along with a false break candle.
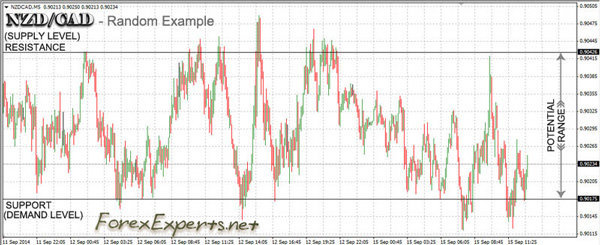
■ Support and resistance define the basic demand and supply price range.
■ A false break candle serves as the trigger for entering the trade.
Explaining Support and Resistance (S&R)
Support is a price level where buying pressure tends to prevent further decline, effectively acting as a floor. Resistance is a level where selling pressure typically stops price advances, acting as a ceiling. When price breaks through either level, it often signals a potential trend continuation or reversal.
 TRADING SIGNALS
This is how you can implement the Falsebreak Candle Strategy:
First, define the range by identifying key support and resistance levels.
■ (↑) Long Trades
-
Wait for the asset's price to reach a significant support level.
-
Look for a candle with a shadow below the support level and a close above it—this is a falsebreak candle.
-
Once the falsebreak candle is confirmed, open a long trade.
■ (↓) Short Trades
-
Wait for the asset's price to reach a significant resistance level.
-
Look for a candle with a shadow above the resistance level and a close below it—this is also a falsebreak candle.
-
Once the falsebreak candle is confirmed, open a short trade.
 TRADING ORDERS
■ Take Profit: 200–250 pips
The take-profit level depends on the size of the range between support and resistance. For a long trade, place the take-profit 5–10 pips below the resistance level. For a short trade, place it 5–10 pips above the support level.
■ Stop-Loss: 80 pips
Set the stop-loss just below the falsebreak in a long trade, or just above the falsebreak in a short trade.
■ Profit/Loss Ratio: 2.5
CHART: Falsebreak Candle Strategy

■ Falsebreak Candle Day-Trading Strategy
ForexExperts.net ©
🔗 READ MORE
» Introduction to Trading Strategies
♞ DAY-TRADE STRATEGIES
» Falsebreak Candle
» Bollinger-RSI
» Stochastic Day-Trade
» Breakout Strategy
♚ SWING-TRADE STRATEGIES
» Riding the Trend
» Moving Envelopes
» MACD Swing
♜ SCALPING STRATEGIES
» Stochastic Scalper
» Bollinger-RSI Scalping
» Hit-Run Trading
♟ STRATEGIES FOR BEGINNERS
» News-Trading
» Follow-The-Trend
» Support and Resistance
» Fibonacci Retracements
» Stochastics Trading
» Chart Patterns
💱 MARKET CORRELATIONS
» US Yields and USDCHF
» Crude Oil and Forex
» USDJPY and US Stock Indices
» AUD and Gold Price Correlation
THE STOCHASTIC TRADING STRATEGY
Day-trading the Forex majors using the Stochastic Oscillator and Fibonacci retracement.
 TRADING STRATEGY
■ Style: Day-Trade Strategy
■ Name: The Stochastic Day-Trading Strategy
💱 FINANCIAL ASSETS
■ Forex Majors (Preferably EURUSD and GBPUSD)
 TIMEFRAME
■ M5 time frame (5-Minutes)
■ 2-4 daily trades
 INDICATORS & SETUP
This strategy combines the Stochastic with the Fibonacci Retracement
■ Stochastic Oscillator
At a Glance: The Stochastic Oscillator
The Stochastic Oscillator measures a currency pair's closing price relative to its price range over a specified period—typically 14 days. It generates two lines, %K and %D, which oscillate between 0 and 100. This indicator helps identify overbought conditions (above 80) and oversold conditions (below 20), signals momentum shifts through line crossovers, and highlights potential reversals by spotting divergences between price action and the oscillator.
Settings:
- 5,3,3 instead of the standard setting (14,3,3)
■ Fibonacci Retracement
At a Glance: The Fibonacci Retracement
Fibonacci Retracement uses horizontal lines based on key Fibonacci ratios (23.6%, 38.2%, 50%, 61.8%, and 78.6%) drawn between a swing high and swing low. These levels help identify potential reversal points where price corrections might pause or reverse before the original trend continues.
Settings:
- Standard settings (.618, .500, .382 and 0.236)
 TRADING SIGNALS
This is how you can implement the Stochastic Strategy:
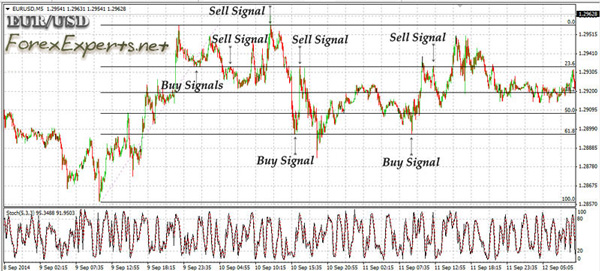
■ First, apply the Fibonacci levels, then look for signals from the Stochastic.
-
Identify the narrowest key support and resistance levels to apply the Fibonacci retracement.
-
Wait for signals from the Stochastic Oscillator.
■ (↑) Long Trades
- Each time EURUSD reaches an important Fibonacci support level and the Stochastic is at 20 and rising, you enter a long (bullish) trade.
■ (↓) Short Trades
- Each time EURUSD reaches an important Fibonacci resistance level and the Stochastic is at 80 and falling, you enter a short (bearish) trade.
 TRADING ORDERS
■ Take Profit: 40-50 pips
■ Stop-Loss: 15-20 pips
■ Profit/Loss Ratio: 2.5
CHART: The Stochastic Strategy (EURUSD)

■ The Stochastic Day-Trading Strategy
ForexExperts.net ©
| 🔗 READ MORE | » Introduction to Trading Strategies | |||
| ♞ DAY-TRADE STRATEGIES | » Falsebreak Candle | » Bollinger-RSI | » Stochastic Day-Trade | » Breakout Strategy |
| ♚ SWING-TRADE STRATEGIES | » Riding the Trend | » Moving Envelopes | » MACD Swing | |
| ♜ SCALPING STRATEGIES | » Stochastic Scalper | » Bollinger-RSI Scalping | » Hit-Run Trading | |
| ♟ STRATEGIES FOR BEGINNERS | » News-Trading | » Follow-The-Trend | » Support and Resistance | » Fibonacci Retracements |
| » Stochastics Trading | » Chart Patterns | |||
| 💱 MARKET CORRELATIONS | » US Yields and USDCHF | » Crude Oil and Forex | » USDJPY and US Stock Indices | » AUD and Gold Price Correlation |
BOLLINGER-RSI DAY-TRADING STRATEGY
Trading the Forex majors by combining the Bollinger Bands and RSI.
 TRADING STRATEGY
■ Style: Day-Trading Strategy
■ Name: Bollinger-RSI Trading Strategy
FINANCIAL ASSETS
 TIMEFRAME
■ M5 timeframe (5-Minutes)
■ 5-7 daily trades
 INDICATORS & SETUP
As the name of the strategy suggest we shall use two indicators, Bollinger Bands and RSI. This is an easy to implement trading strategy which may prove considerably profitable given the right market conditions.
Setting the Bollinger Bands and RSI:
■ Bollinger Bands
At a Glance: Bollinger Bands
'Bollinger Bands' is a volatility-based technical indicator composed of a middle simple moving average (SMA) and two outer bands set at standard deviations above and below the SMA. These bands expand during periods of high market volatility and contract when the market is calm. Traders use Bollinger Bands to identify overbought or oversold conditions, assess trend strength, and anticipate potential breakouts—especially when a “squeeze” occurs, signaling a likely sharp price movement.
Price Breakout Strategy
Breakout trading involves entering a strong trend in its early stages. The goal of this strategy is to capitalize on a significant price movement while limiting downside risk.
What is a Price Breakout?
A breakout occurs when the price of an asset moves beyond a defined price level. This level could be a support or resistance line, a channel, a trend line, a Fibonacci level, a pivot point, or similar. Breakouts are significant because they are often followed by strong price swings.
However, be aware that most breakouts turn out to be false. Still, when breakouts are genuine, they can lead to highly profitable positions.
Types of Price Breakouts
Price breakouts are generally classified into continuation and reversal breakouts:
(i) Continuation breakouts
(ii) Reversal breakouts
Continuation breakout
In a continuation breakout, the price breaks through an established level (usually a previous high) and continues trending. The aim is to take profits near the next local high. The longer the price has been accumulating before the breakout, the stronger the breakout is likely to be.
Rating Formula Comparisons
Trade Strategy
Forex Brokers
💡 Forex Ratings
 Forex Broker Ratings Powered by the Next-Generation RatingFormula 5.0 (?)
The RatingFormula series, developed by George M. Protonotarios, is designed to bring objectivity to online corporate ratings. In the future, search engines and various applications are expected to adopt similar rating algorithms to accurately assess the true value of online corporations for users and rank them accordingly in search results.


