Line-Break and 3-Line Break Charts
A Line-Break chart is a Japanese chart style similar to Renko or Point-and-Figure (P&F) charts. This type of chart ignores time and draws lines only when the price moves by a significant amount. Line-Break charts are particularly useful for identifying and confirming trend reversals.
📈 Introduction to Line Break Charts and the 3-Line Chart
Line Break Charts completely ignore time intervals and focus solely on price action and the current price trend. They can be applied across all timeframes and financial asset classes. The user defines the number of line values, typically 2 or 3.
The four (4) types of lines are:
-
Uptrend Lines (formed when the closing price exceeds the previous line's high)
-
Downtrend Lines (formed when the closing price falls below the previous line's low)
-
Projected Uptrend Lines (an upward projection before actual closing)
-
Projected Downtrend Lines (a downward projection before actual closing)
The Line Break Chart draws a new line only when the price forms a new high or low compared to the previous high or low. If the price does not exceed these thresholds, no new line is drawn. Each line is based solely on the closing price, not on the high or low of the period.
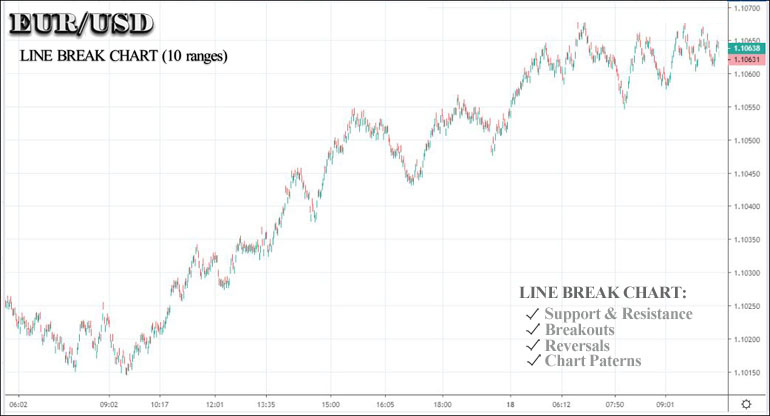
Chart: EURUSD Line Break Chart

In the above EURUSD chart (TradeView.com) we use 10 ranges.
📌 Uses of a Line Break Chart
A Line Break Chart consists of up and down bars, with the number of lines determined by the user. In contrast to classical chart types, a Line Break Chart eliminates the influence of time and focuses solely on the direction of the market.
(a) Recognizing Support and Resistance Areas
A Line Break Chart can effectively identify zones of strong support and resistance.
(b) Spotting Price Breakouts
Since a Line Break Chart is built on the ‘breaking’ of previous highs and lows, it is well-suited for detecting price breakouts.
(c) Spotting Price Reversals
Line Break Charts are particularly valuable for identifying potential reversals. Refer to the end for more detailed information.
(d) Identifying Classic Chart Patterns
Like traditional chart types, Line Break Charts can reveal recognizable patterns such as Triangles, Head & Shoulders, Double Tops/Bottoms, and Triple Tops/Bottoms.
🎯 The 3-Line Chart
The most commonly used Line Break setting is three (3), which is why this chart is often referred to as a 3-Line Break Chart. It focuses on the breaking of the previous three lines. A new line is created each time the closing price moves above the high or below the low of the prior three lines.
How Are New Lines Formed?
At the end of each closing period, there are three possible outcomes:
(i) No Line – If the price remains unchanged or if a reversal occurs without meeting the required criteria, no new line is added.
(ii) New Continuation Line – If the price continues in the same direction and breaks the high or low accordingly, a new same-color line is drawn.
(iii) New Reversal Line – If the price moves significantly in the opposite direction (meeting the reversal criteria), a new line of a different color is formed.
📌 Key-Points
These are some key points of the Line Break chart:
-
The lines are constructed based on specific criteria and filters.
-
The user defines the number of line values.
-
Each line is based on the closing price, not on the high/low range of each period.
-
Line Break charts are purely price-driven and do not rely on time intervals.
-
The time axis displays dates that are unevenly spaced, unlike classical chart types.
-
A wide range of chart patterns can be identified, along with support and resistance levels.
-
Both simple and complex indicators can be applied.
-
A Line Break chart is an effective tool for confirming price breakouts, especially reversals.
⚙️ How to Trade Reversals Using the 3-Line Break Chart
The 3-Line Break chart can be a reliable tool for identifying and trading reversals.
Typically, you wait for the price to form three or more consecutive lines in the same direction (upward or downward), followed by the formation of a reversal line. Once the reversal line appears, a trade is initiated in the direction of the reversal.
To confirm entry signals, the 3-Line Break chart can be combined with a momentum oscillator such as RSI or Stochastic. For intraday trading, a preferred method of identifying overbought or oversold levels is using the RSI(21) on the M5 timeframe.
◙ Line-Break and 3-Lines Break Charts
ForexExperts.net
🔗 READ MORE
» Identifying Patterns
» Pattern Recognition
» Line-Break Chart
» Heikin-Ashi Chart
» Renko Price Chart
» Range Chart
» Tick Price Charts


